BTC PRICE MOVEMENT
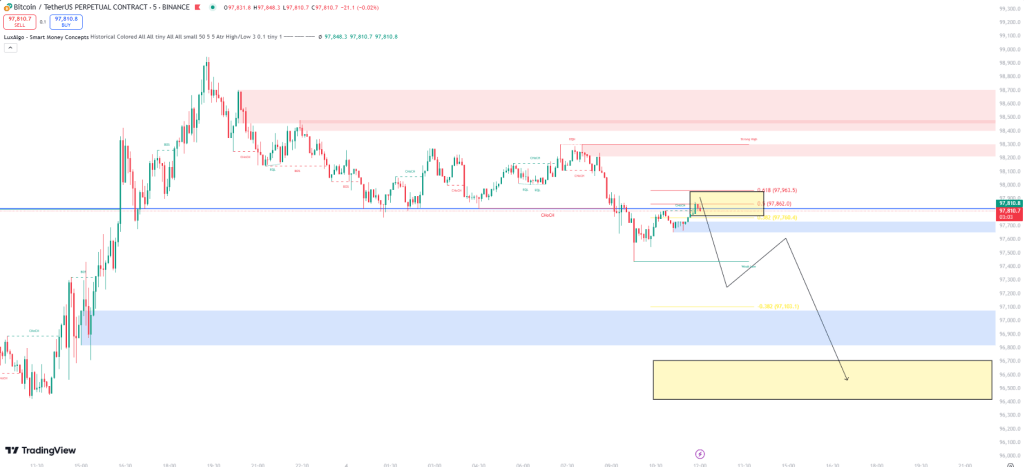
BTC 97747$ PRICE HAVE A ONE CHANCE CHANCE TO BEARISH
MAIN TARGET 96543$
PRINTEREST – https://www.pinterest.com/maduhansakaveesha21/
COIN MARKET CAP – https://coinmarketcap.com/
BTC PRICE MOVEMENT
How to Use the Relative Strength Index (RSI) Indicator

The Relative Strength Index (RSI) is a popular technical indicator used by traders to evaluate the strength and momentum of a market trend. Developed by J. Welles Wilder in 1978, the RSI helps identify overbought or oversold conditions in a market, making it a powerful tool for predicting potential price reversals or confirming trends.

What Is the RSI?
The RSI is a momentum oscillator that measures the speed and change of price movements. It ranges from 0 to 100 and is typically displayed as a line graph beneath the main price chart. The two key levels to watch are 70 and 30:

Above 70: Indicates the market is overbought, signaling a potential reversal or pullback.
Below 30: Suggests the market is oversold, indicating a possible reversal or rally.
The default period for RSI calculation is 14 (commonly referred to as RSI-14), but traders can adjust this based on their strategy and time frame.

How the RSI Is Calculated
The RSI is computed using the following formula:


Where:

RS (Relative Strength) = Average Gain / Average Loss over the specified period.
The calculation involves:

Determining the average gain and loss over the chosen period (e.g., 14 days).
Dividing the average gain by the average loss to obtain the Relative Strength (RS).
Plugging RS into the RSI formula to derive a value between 0 and 100.
How to Use the RSI in Trading
1. Identify Overbought and Oversold Levels
When the RSI moves above 70, the asset may be overbought, suggesting it could be due for a correction or reversal. Traders often use this as a signal to sell or short the asset.
When the RSI drops below 30, the asset may be oversold, indicating a potential buying opportunity as the price might rebound.
2. Spot Divergences
RSI divergence occurs when the price and the RSI move in opposite directions. This can signal a potential trend reversal:

Bullish Divergence: Price makes a lower low, but the RSI forms a higher low. This suggests the bearish momentum is weakening, and a bullish reversal could follow.
Bearish Divergence: Price makes a higher high, but the RSI creates a lower high. This indicates that the bullish momentum is fading, and a bearish reversal might occur.
3. Confirm Trends
The RSI can help confirm the strength of a trend:

In an uptrend, the RSI often stays above 50 and frequently bounces between 40 and 80.
In a downtrend, the RSI typically stays below 50 and oscillates between 20 and 60.
4. Use RSI with Support and Resistance
RSI signals can be more reliable when combined with support and resistance levels. For example:

If the RSI indicates oversold conditions near a strong support level, it reinforces the likelihood of a price bounce.
If the RSI shows overbought conditions near resistance, it strengthens the case for a potential price drop.
5. Combine RSI with Other Indicators
To enhance accuracy, traders often use the RSI in conjunction with other indicators such as Moving Averages, MACD, or Bollinger Bands. For example:

If both the RSI and the MACD signal a bearish divergence, it increases the confidence in a potential trend reversal.
RSI Strategies for Different Timeframes
1. Short-Term Trading
Use RSI on smaller timeframes (e.g., 5 or 15 minutes) for scalping or day trading.
Look for quick overbought and oversold signals but beware of false signals due to increased market noise.
2. Swing Trading
Apply RSI on medium timeframes (e.g., 4-hour or daily charts).
Combine RSI levels with chart patterns like double tops, double bottoms, or trendlines for higher accuracy.
3. Long-Term Investing
Use RSI on weekly or monthly charts to identify macro trends and long-term entry or exit points.
Overbought and oversold signals are more reliable on higher timeframes.
Common Mistakes to Avoid
Relying Solely on RSI: The RSI is a useful tool, but it should not be used in isolation. Always consider other factors like volume, chart patterns, and market news.
Ignoring Market Context: Overbought does not always mean the price will drop immediately, especially in a strong uptrend. Similarly, oversold conditions might persist during a downtrend.
Overtrading: Overusing RSI signals on low timeframes can lead to excessive trades and reduced profitability.
Conclusion
The RSI is a versatile and easy-to-use indicator that can enhance any trading strategy. By identifying overbought and oversold conditions, spotting divergences, and confirming trends, traders can make more informed decisions. However, like any tool, its effectiveness depends on proper application and integration with other strategies. Practice using the RSI on demo accounts and refine your approach to match your trading style and objectives.